Multi-Field Integration
vortrace can project multiple scalar fields simultaneously. This is useful
for computing mass-weighted quantities: project both the density and the
density-weighted quantity, then take their ratio.
Example: mass-weighted temperature
import numpy as np
import vortrace as vt

# Stack density and density * temperature as two fields
fields = np.column_stack([rho, rho * temperature])
print(f"Fields shape: {fields.shape}")  # (N, 2)

pc = vt.ProjectionCloud(
    pos, fields, vol=vol,
    boundbox=[0, BoxSize, 0, BoxSize, 0, BoxSize],
)

extent = [BoxSize / 2 - L / 2, BoxSize / 2 + L / 2]
bounds = [0, BoxSize]
npix = 256

dat = pc.grid_projection(extent, npix, bounds, center=None)
print(f"Output shape: {dat.shape}")  # (256, 256, 2)

# Recover mass-weighted temperature
column_density = dat[:, :, 0]
T_map = dat[:, :, 1] / dat[:, :, 0]
#include <vortrace/vortrace.hpp>
#include <vector>

// Build a flat fields array with 2 fields per particle:
//   fields[i * 2 + 0] = rho[i]
//   fields[i * 2 + 1] = rho[i] * temperature[i]
size_t nfields = 2;
std::vector<double> fields(npart * nfields);
for (size_t i = 0; i < npart; i++) {
    fields[i * 2 + 0] = rho[i];
    fields[i * 2 + 1] = rho[i] * temperature[i];
}

PointCloud cloud;
cloud.loadPoints(pos, npart, fields.data(), npart, nfields, subbox);
cloud.buildTree();

// Set up rays (see grid_projection tutorial)
Projection proj(starts.data(), ends.data(), ngrid);
proj.makeProjection(cloud, ReductionMode::Sum);

const auto& data = proj.getProjectionData();
// data[i * 2 + 0] = column density for ray i
// data[i * 2 + 1] = density-weighted temperature integral for ray i
// mass-weighted T = data[i*2+1] / data[i*2+0]
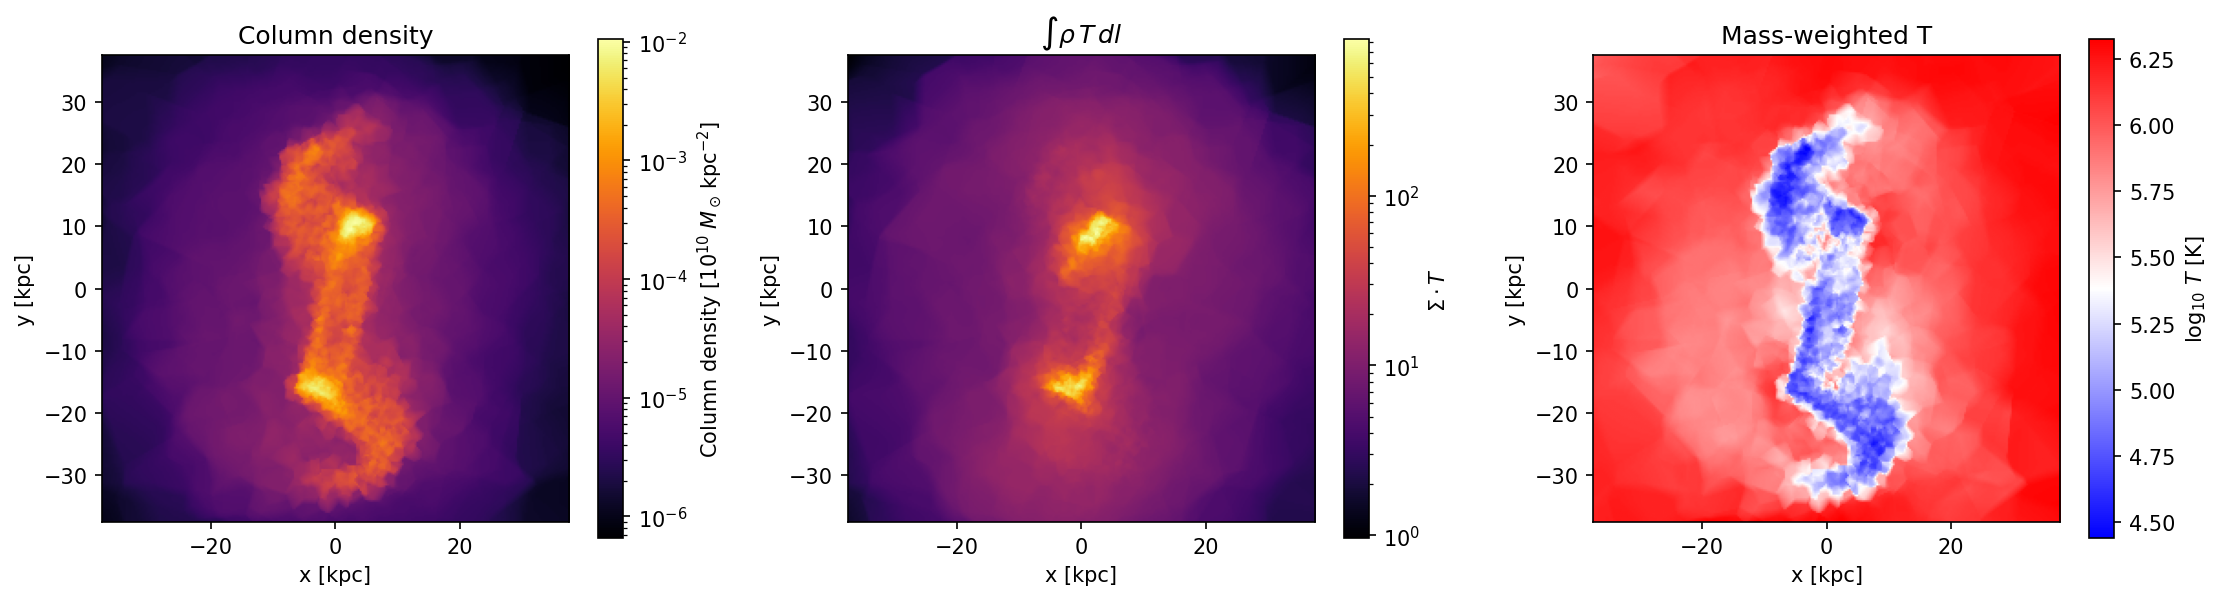
Plotting
import matplotlib.pyplot as plt

fig, axes = plt.subplots(1, 3, figsize=(15, 4))
ext = [-L / 2, L / 2, -L / 2, L / 2]

vt.plot.plot_grid(dat[:, :, 0], extent=ext, ax=axes[0],
                  label=r"$\Sigma$")
axes[0].set_title("Column density")

vt.plot.plot_grid(dat[:, :, 1], extent=ext, ax=axes[1],
                  label=r"$\Sigma \cdot T$")
axes[1].set_title(r"$\int \rho \, T \, dl$")

vt.plot.plot_grid(np.log10(T_map), extent=ext, ax=axes[2],
                  log=False, label="T", cmap="bwr")
axes[2].set_title("Mass-weighted T")
Note
The field layout is always [particle_index * nfields + field_index]
in C++ and (N, nfields) in Python (row-major in both cases).